This window is the primary means of performing inference using a model. (An alternate method is to use bar charts on the main diagram window; see Bar Charts for more information.)
Performing inference means manipulating evidence in a model and obtaining the posterior probabilities resulting from the changes in evidence.
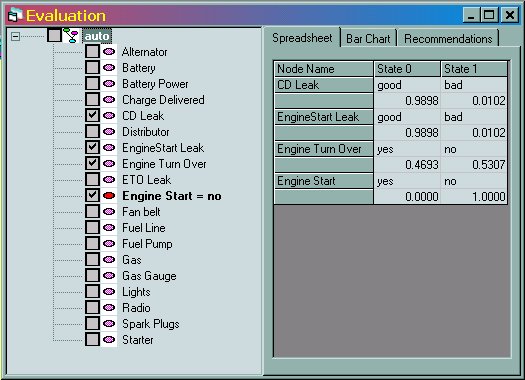
There are two primary sections to the Evaluation window. The left-hand pane contains a tree-based view of the nodes in the model. The right-hand pane contains a tabbed display of the results of inference presented in several ways.
The basic Evaluation window has the results for a single model. The form can be extended to contain several pairs of evaluation panes (tree view and tabs), each of which can have a different appearance or represent a different model. See Evaluation Display Options for more information.
Purpose of the Tree View
The primary purposes of the tree view are to allow you to choose which model variables are shown in the results pane and to enter or remove evidence from the model's nodes. Clicking in the black rectangle next to a node's name causes the posterior probabilities of that node to appear in the spreadsheet and bar chart views to the right of the tree. Right-click on the name of a node and a menu appears containing state names for the node, allowing you to change the evidence.
The Tree View also has a context menu that appears when you right-click on the empty area of its window. This context menu can be used to clear all evidence.
Organizing the Tree View
By default, the Tree View has a single root level, named after the model itself. In the default view, all the nodes of the model are attached directly to this level.
You can also use node properties to create another level of organization in the tree view. See Evaluation Display Options for more information.
The right-hand section of an Evaluation window normally has a set of tabs across its top. (This can be controlled using the Evaluation Display Options.)
Spreadsheet Results
When the Spreadsheet tab is active, posterior probabilities are shown for the nodes that are checked in the tree view. Each pair of rows represents a node, and each column represents a state of that node.
Bar Chart Results
When the Bar Chart tab is active, a vertical colored bar appears for each node checked in the tree view. The probability mass associated with each state is represented as a distinct color band in the bar.
If only one node is displayed, the state names of that node are used as the legend. If more than one node is displayed, the legend becomes "State 0", "State 1", etc.
Recommendations Results
During evaluation, models configured to support troubleshooting or diagnostic recommendations can provide an ordered list of most effective diagnostic steps. See Troubleshooting Overview and Mechanics for details about how to enhance a model to support troubleshooting or diagnostic behavior.
The Recommendations tab shows an ordered list of nodes (by name and description). Each set of lines in the list shows the information score (cost in dollars) of the node and each state of the node. The nodes are shown in order of least cost.
To use the Recommendations list, double-click on the state name of any node in the list, or set evidence using the tree view pane to the left.
The tree view is primarily used for two purposes.
Determining which nodes are displayed in the Spreadsheet and Bar Chart tabs
Setting and clearing evidence about the nodes in the model.
To set or clear evidence against a single node, right-click on the node's entry in the tree view and use the pop-up context menu to set the node to the state desired.
To clear all evidence in the model, right-click on the tree view in the empty space outside of any node entry. Select the Clear All Evidence menu item.