
 Visualize your data over the web: add complex dynamic graphs and maps to your web application.
Interactive Data Display, also known as Dynamic Data Display, is available on multiple platforms.
HTML5
Interactive Data Display for JavaScript (IDD for short) is a set of controls for adding interactive visualization of dynamic data to your HTML5 application. It allows to create line graphs, bubble charts, heat maps and other complex 2D plots which are very common in scientific software. Interactive Data Display integrates well with Bing Maps control to show data on a geographic map in latitude/longitude coordinates. The controls can also be operated programmatically.
Live samples of Interactive Data Display in action
WPF
Interactive Data Display for WPF is a set of controls for adding interactive visualizations of dynamic data to your application. It allows to create line graphs, bubble charts, heat maps and other complex 2D plots which are very common in scientific software. Interactive Data Display for WPF integrates well with Bing Maps control to show data on a geographic map in latitude/longitude coordinates. The controls can also be operated programmatically.
Silverlight
Microsoft Silverlight is an attractive environment to run software tools for sciences in. It has full support for modern programming languages such as C# or F#, lightweight browser-based deployment, and it is supported on both Windows and Macs. What impedes even broader use of Silverlight in scientific research is the lack of reusable software components which are specifically designed for scientific applications.
Dynamic Data Display closes this gap by adding interactive visualization of dynamic data to your Silverlight application. It contains a set of Silverlight controls for creating line graphs, bubble charts, heat maps and other complex 2D plots which are very common in scientific software. Dynamic Data Display integrates well with Bing Maps control to show data on a geographic map in latitude/longitude coordinates. The controls are compatible with most popular development tools like Expression Blend and Visual Studio. They can also be operated programmatically.
Download Dynamic Data Display for Silverlight
The downloadable package contains all you need to use Dynamic Data Display controls in your applications including API reference documentation and guidelines for extending the library.
Dynamic Data Display for Silverlight was designed by Vassily Lyutsarev and Sergey Berezin with contributions from Dmitry Grechka, Eugene Nourminsky, Alexey Semenov, Nikita Skoblov and Natalia Stepanova.
| Simple line graph | Bubble chart | Custom markers |
 |
 |
 |
| Adding a simple graph to your program requires as little as four lines of code in total. | Marker graph is a very flexible chart type. Note that both ‘colour’ and ‘size’ properties of a marker are bound to data. | Instead of standard rectangles and circles you may use a drawing of any complexity. |
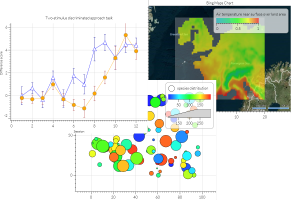
| Composite graph | Mapping geo-data | Heat map |
 |
 |
 |
| This picture is a composition of 3 individual plots: a line graph, a standard marker graph that adds points on the line and a customized marker graph to draw error bars. |
Lines and markers can easily be placed on a standard Bing map. | Heat maps can use any palette of user choice. |
People
Vassily Lyutsarev
Principal Research Software Development Engineer

Sergey Berezin
Moscow State Unitersity

Dmitry Voytsekhovskiy
Moscow State Unitersity
Elena Pochernina
Research Software Engineer