As do other recreational pilots, Ashish Kapoor (opens in new tab) learned during flight training that he shouldn’t count on the accuracy of wind forecasts. The best available forecasts in the United States—from the federal government’s Winds Aloft program—have been based largely on data from instrumented weather balloons released twice a day, providing forecasts for 176 stations across the United States.
“They would tell you, ‘Winds Aloft is often not accurate, so you have to take that into account when you make your flight plan,’” says Kapoor, a Microsoft researcher who specializes in machine learning and decision-making. Pilots learn to plan for longer flight times and greater fuel consumption, he says, in case the actual wind conditions are not as expected.
In our data-driven, sensor-filled world, that lack of precision motivated an effort to devise a better solution.
Microsoft research blog

PromptWizard: The future of prompt optimization through feedback-driven self-evolving prompts
PromptWizard from Microsoft Research is now open source. It is designed to automate and simplify AI prompt optimization, combining iterative LLM feedback with efficient exploration and refinement techniques to create highly effective prompts in minutes.
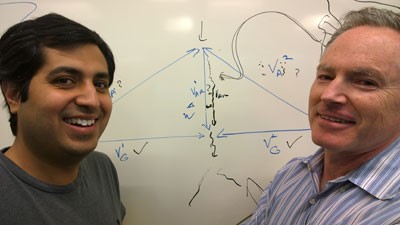
Ashish Kapoor (left) and Eric Horvitz
Kapoor and his colleague Eric Horvitz (opens in new tab), a Microsoft distinguished scientist and managing director of Microsoft Research Redmond (opens in new tab), began looking for such a solution—specifically, one that would not involve installing new sensors or other equipment. They focused on using aircraft in flight as a possible source of data.
It turns out that data about the tens of thousands of flights over the United States each day are publicly available from the Federal Aviation Administration (FAA). That means people can view any commercial aircraft’s flight plan—the planned airspeed (fixed cruising speed relative to the air mass), altitude, distance, and route—as well as the observed groundspeed (speed relative to the ground), altitude, longitude, and latitude at any moment during the flight, with only a small time lag.
Live access: Real-time Windflow map of the continental United States (opens in new tab)
“Our research question was: Could we take the information that was already available and use it to predict wind conditions without needing any additional infrastructure?” Kapoor says. In other words, could airplanes in flight be employed as a vast sensor network to determine atmospheric conditions? Could data available today be used to infer winds on a large scale without special plane-based wind sensors and new infrastructure to access and combine signals from planes?
Because winds will change an aircraft’s flight path and affect the groundspeed, the researchers determined that they could estimate the wind conditions mathematically.
That sounds straightforward enough—if no wind is present, the groundspeed will match the airspeed and the plane will fly along its intended course. If you know the groundspeed and the airspeed, along with where the plane is heading and its actual course over the ground, you can calculate the wind speed and direction.
But one key piece of data was unavailable: The data provided by the FAA does not include information about where a plane is headed.
Solving this conundrum involved a creative leap—what Kapoor calls their “biggest intellectual aha moment.” They realized that winds exhibit a special property known as spatial regularity—that is, nearby airplanes are likely to encounter similar winds. They then figured out a way to exploit this property by taking observations from nearby wind stations, combining it with the FAA data, and then using a probabilistic model to infer the wind velocity. In essence, they came up with a way to solve a puzzle despite many missing pieces.
Comparing Predictions with Ground Truth
To help with testing the accuracy of their model, which they call Windflow (opens in new tab), Kapoor and Horvitz—along with two high school researchers, Spencer Laube and Horvitz’s son, Zachary, both students at the Seattle Academy of Arts and Sciences—launched a helium-filled high-altitude balloon in eastern Washington state in June 2013. Equipped with a GPS device, barometric and temperature sensors, and an onboard computer, the balloon was carried by the wind, reaching an altitude of 95,000 feet.
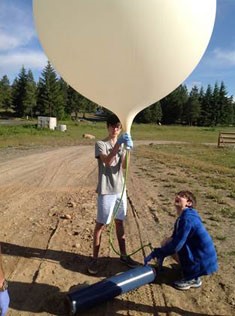
Zachary Horvitz (left) and Spencer Laube prepare to launch an instrumented high-altitude balloon.
Before launch, they estimated the endpoint of the balloon’s journey—when it would reach maximum altitude and rupture—using their own model, as well as the Winds Aloft model from the National Oceanic and Atmospheric Administration (NOAA). The results were striking: The Winds Aloft prediction was off by 56.2 miles, in an easterly direction, while the researchers’ prediction was off by only 11.6 miles, in the same direction.
A small aircraft would spend much less time traveling the same route and climbing through those altitudes, but the NOAA error is “a pretty big cumulative error in terms of winds across altitude profiles,” Kapoor says.
It could certainly be significant for high-altitude balloons deployed for research purposes, which often carry expensive instrumentation that parachutes to the ground when the balloon bursts at a certain height.
“The error,” Kapoor says, “could make a difference in the ability to recover the balloon’s payload.”
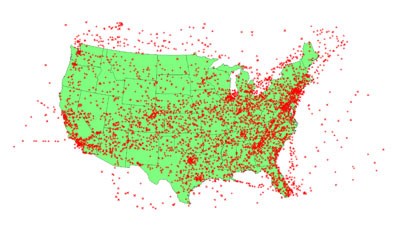
In addition to publishing their findings in a paper (opens in new tab), Kapoor and Horvitz have made their predictive model publicly available on the Microsoft Azure (opens in new tab) cloud service. The service graphically depicts the Windflow model, the Winds Aloft model, and the differences between them on a map of the continental United States.
The views are computed every three hours during the daytime, using a subset of aircraft rather than all of the aircraft in flight.
“It turns out that the biggest obstacle was getting the data—we have to pay for each piece of data from each aircraft,” Kapoor says. This is because the only practical way for the researchers to access the FAA data—for now—is through a commercial website that charges for each ping to an aircraft.
“The cost becomes prohibitive,” says Kapoor. “We had a budget, so we had to decide which planes to track.”
Their budget, which is enough to track 100 planes, led Kapoor and Horvitz into another area of research that also is detailed in their paper—computing the “expected value of information” that each plane might contribute to determine which 100 planes to sample at any given time to yield the most valuable data for wind prediction over the entire continent.
Every airplane in flight can act as a sensor to help estimate large-scale wind conditions.
These days, when Kapoor is out on a weekend flight—usually in a two-seater or a four-seater—he says he uses the Windflow predictions in addition to NOAA forecasts for his flight plans:
“I look at the Windflow data on my phone.”
Although most of the Windflow data is for higher altitudes where commercial aircraft generally fly, the predictions go as low as 6,000 feet, which can be useful to recreational pilots such as Kapoor. Not only does Windflow provide finer resolution of wind directions than Winds Aloft, but Kapoor also has found that its wind-velocity predictions are more accurate.
Kapoor and Horvitz foresee an array of applications for the Windflow methodology.
“The ongoing inferences can be used to identify ideal routes for aircraft, enabling faster trips that use less fuel and output less carbon dioxide,” Horvitz says. “Other applications include using the finer-grained wind reports for guiding and predicting the trajectories of gliders and balloons, whether they are being used for communications, sensing, or recreation.”
The results also can be used to improve understanding of phenomena such as turbulence and larger-scale weather processes, as well as for storm tracking—an area in which, Kapoor notes, current predictive methodologies are particularly unreliable.
In the Flow
Windflow is the latest in a series of efforts at Microsoft Research to use machine learning and reasoning to create new kinds of services.
Smartflow (opens in new tab), created more than a decade ago, uses highway-flow data, accident reports, weather, and major local events to predict where traffic bottlenecks will form and how long they will last. The system even performs surprise forecasting (opens in new tab)—using machine learning about surprising situations over many years to predict when people likely will be surprised by atypical jams or unexpected wide-open flows and alerting drivers before the flows or jams happen.
That project led to an even more intensive effort called Clearflow (opens in new tab), which uses large quantities of highway and GPS data, along with the topology or structure of the traffic network, to predict flows on all streets in a greater metropolitan area. The inferences from Clearflow have been used to generate traffic-sensitive directions (opens in new tab) in Bing Maps (opens in new tab) since 2008, providing enhanced routing information for cities throughout North America.
“Windflow,” Horvitz says, “is a great example of where things are headed with using machine intelligence to perform sensing, learning, and reasoning about large-scale phenomena like winds and weather—and to stream the insights down to people who can make use of the inferences in their decision-making.
“I’m very excited about the results and directions with Windflow.”